今天來寫關於Android中MPChart圖表框架一些功能-MakerView以及X軸標籤的部分
我之前有寫過關於在Android中圖表的設置(-‿◦)
->碼農日常-『Android studio』使用MPChart第三方資料庫在Android裝置上繪製圖表
這那文章中,最後完成的功能如下
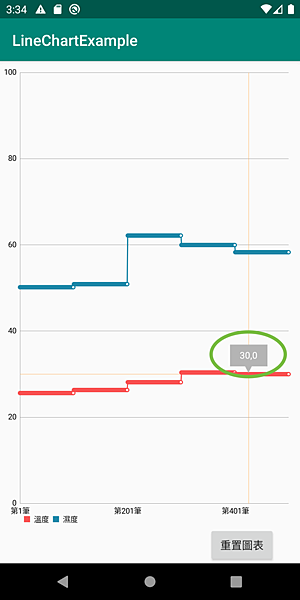
在打圈的部分,當時的圖表僅能做到顯示一條線的資訊
那本篇文章中,將要介紹如何寫出所有資訊,如下圖
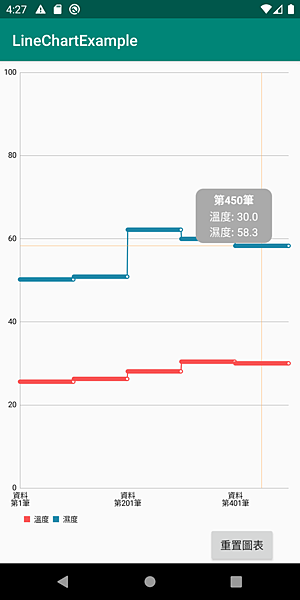
以及還有另一個要注意的,就是我在標籤中的更動
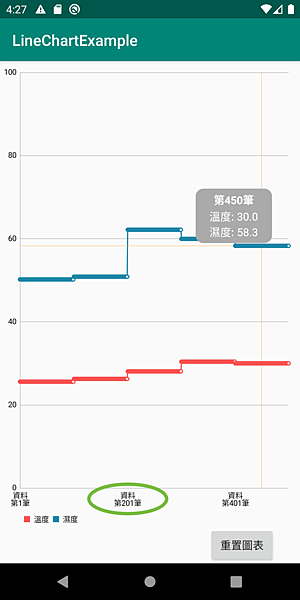
Okay,以上幾個就是今天要介紹的內容
來看一下功能吧!
以及Github
->https://github.com/thumbb13555/LineChartExample
此外,本次的內容將沿用之前寫過的這篇
碼農日常-『Android studio』使用MPChart第三方資料庫在Android裝置上繪製圖表
文章去修改,如果對於圖表設置不熟悉的朋友建議可以先參考這篇的內容
如果需要在Github看舊程式的朋友,可以參考這篇
->碼農日常-『Android studio』Room資料庫建立與操作(Kotlin)的第四大段,有圖文教學喔
那~開始吧:D
1. 這篇到底新增了哪些內容?

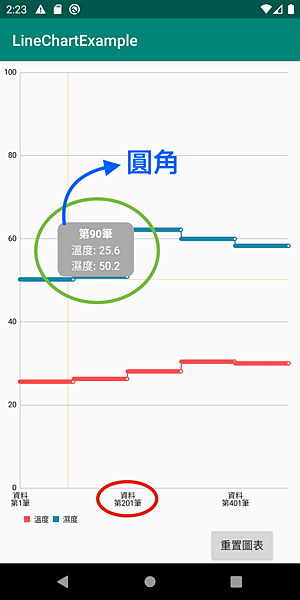
其分別對應圖中的三個顏色
關於兩行的X軸可能有些人會有疑惑...為何要特別寫一篇?
其緣由是來自於stack overflow中的一個問題
->In MPAndroidChart Library, How to wrap X Axis Labels to two lines when long?
在MPChart這個圖表UI框架中..恩~也不能算是缺點啦(´・д・`)
就是有一點..怎麼說..比較沒這麼完善的地方?
畢竟人家都已經幫我們些出那麼完整的UI框架了,其實也不要東嫌西嫌啦XD
但是很明顯,在沒有更動的情況下,就算再字串中放入換行符號"\n",X軸的標籤頁不會執行換行
於是今天就是來解決這個問題的
2. MyMarkerView.java撰寫
首先來修改MyMarkerView.java的部分
此處原先的程式如下
public class MyMarkerView extends MarkerView {

    private final TextView tvContent;

    public MyMarkerView(Context context, int layoutResource) {
        super(context, layoutResource);

        tvContent = findViewById(R.id.tvContent);
    }

    // runs every time the MarkerView is redrawn, can be used to update the
    // content (user-interface)
    @Override
    public void refreshContent(Entry e, Highlight highlight) {

        if (e instanceof CandleEntry) {

            CandleEntry ce = (CandleEntry) e;

            tvContent.setText(Utils.formatNumber(ce.getHigh(), 1, true));
        } else {

            tvContent.setText(Utils.formatNumber(e.getY(), 1, true));
        }

        super.refreshContent(e, highlight);
    }

    @Override
    public MPPointF getOffset() {
        return new MPPointF(-(getWidth() / 2), -getHeight());
    }
}
那我們把它改成這樣
public class MyMarkerView extends MarkerView {

    private TextView tvValue, tvTitle;
    private ArrayList<String> customxLable;
    private LineChart chart;

    public MyMarkerView(Context context, int layoutResource, ArrayList<String> customxLable,LineChart chart) {
        super(context, layoutResource);
        this.customxLable = customxLable;
        this.chart = chart;
        tvTitle = findViewById(R.id.textView_Title);
        tvValue = findViewById(R.id.textView_Value);
    }

    @Override
    public void refreshContent(Entry e, Highlight highlight) {
        String label = customxLable.get(Math.round(e.getX())).replace("資料\n","");
        tvTitle.setText(label);
        int line =  chart.getLineData().getDataSets().size();

        StringBuffer value = new StringBuffer();
        for (int i = 0; i <line ; i++) {
            ILineDataSet set = chart.getLineData().getDataSets().get(i);
            String s = set.getLabel()+": "+set.getEntryForIndex(Math.round(e.getX())).getY();
            if (i<line-1) value.append(s+"\n");
            else value.append(s);
        }
        tvValue.setText(value);

        super.refreshContent(e, highlight);
    }

    @Override
    public MPPointF getOffsetForDrawingAtPoint(float posX, float posY) {
        if (posX < 300) return new MPPointF(-getWidth() / 2f+100f, -getHeight() - 10f);
        else return new MPPointF(-getWidth() / 2f-100f, -getHeight()-10f);
    }
}
重點有幾個,首先看建構子的部分
private TextView tvValue, tvTitle;
private ArrayList<String> customxLable;
private LineChart chart;

public MyMarkerView(Context context, int layoutResource, ArrayList<String> customxLable,LineChart chart) {
    super(context, layoutResource);
    this.customxLable = customxLable;
    this.chart = chart;
    tvTitle = findViewById(R.id.textView_Title);
    tvValue = findViewById(R.id.textView_Value);
}
除了原先的Context跟layoutResoure的部分、這次多輸入了chart本身以及當初輸入Xlabel的陣列
然後layout的部分也做了一些修改
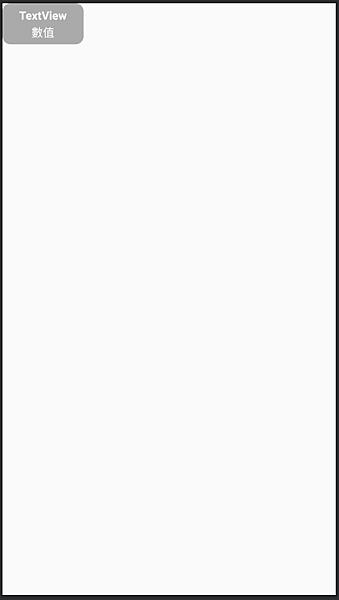
<?xml version="1.0" encoding="utf-8"?>
<androidx.constraintlayout.widget.ConstraintLayout
    xmlns:android="http://schemas.android.com/apk/res/android"
    xmlns:app="http://schemas.android.com/apk/res-auto"
    android:layout_width="100dp"
    android:layout_height="wrap_content"
    android:background="@drawable/round_layout"
    android:backgroundTint="@android:color/darker_gray"
    android:padding="5dp"
    >
    <TextView
        android:id="@+id/textView_Title"
        android:layout_width="0dp"
        android:layout_height="wrap_content"
        android:text="TextView"
        android:textAlignment="center"
        android:textAllCaps="false"
        android:textColor="@android:color/white"
        android:textSize="14sp"
        android:textStyle="bold"
        app:layout_constraintEnd_toEndOf="parent"
        app:layout_constraintStart_toStartOf="parent"
        app:layout_constraintTop_toTopOf="parent"
        />
    <TextView
        android:id="@+id/textView_Value"
        android:layout_width="0dp"
        android:layout_height="wrap_content"
        android:layout_gravity="center"
        android:layout_marginTop="2dp"
        android:ellipsize="end"
        android:gravity="center"
        android:text="數值"
        android:textColor="@android:color/white"
        android:textSize="14sp"
        app:layout_constraintBottom_toBottomOf="parent"
        app:layout_constraintEnd_toEndOf="parent"
        app:layout_constraintStart_toStartOf="parent"
        app:layout_constraintTop_toBottomOf="@+id/textView_Title" />
</androidx.constraintlayout.widget.ConstraintLayout>
再來是顯示內容的部分..
@Override
public void refreshContent(Entry e, Highlight highlight) {
    String label = customxLable.get(Math.round(e.getX())).replace("資料\n","");
    tvTitle.setText(label);
    int line =  chart.getLineData().getDataSets().size();

    StringBuffer value = new StringBuffer();
    for (int i = 0; i <line ; i++) {
        ILineDataSet set = chart.getLineData().getDataSets().get(i);
        String s = set.getLabel()+": "+set.getEntryForIndex(Math.round(e.getX())).getY();
        if (i<line-1) value.append(s+"\n");
        else value.append(s);
    }
    tvValue.setText(value);

    super.refreshContent(e, highlight);
}
比較值得注意的是這邊
ILineDataSet set = chart.getLineData().getDataSets().get(i);
其實ILineDataSet就是指每一條"線"的類別
而每一條"線"也很貼心,他都會順便給你一些資訊,像是這條線的Label名稱,抑或是內容等等的
因此我們就可以從這條"線"裡面去尋找每個點所要的資料
最後是底下getOffsetForDrawingAtPoint的複寫
@Override
public MPPointF getOffsetForDrawingAtPoint(float posX, float posY) {
    if (posX < 300) return new MPPointF(-getWidth() / 2f+100f, -getHeight() - 10f);
    else return new MPPointF(-getWidth() / 2f-100f, -getHeight()-10f);
}
這邊是我用來偵測顯示位置的,如果這裡不處理就會如下
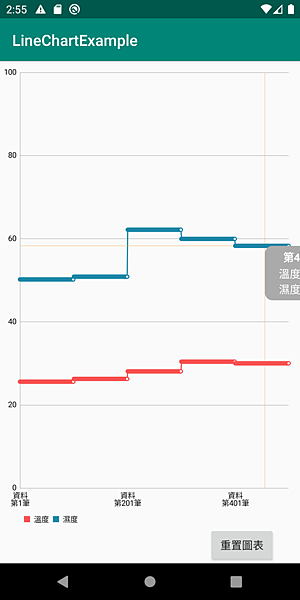
Emmmm..他跑出去了(´・д・`)

所以把它寫上去後,我只要判斷超過300點,就會自動把標籤往另一個方向移動囉~
3. CustomXLabel.java撰寫
為何在MPChart中的X-Label不會自動換行呢?
原因在於作者可能基於某修原因沒有寫關於換行符號的判斷吧..不過最大的理由是因為那個自不是我們尋常看得到TextView原生元件
而是可以把它視為一張"圖片"
所以變成是如果要使他換行,就是要自己去做圖片的位移
那這個位移要如何實踐呢?
~
~
直接給你程式XD
class CustomXLabel extends XAxisRenderer {
    public CustomXLabel(ViewPortHandler viewPortHandler, XAxis xAxis, Transformer trans) {
        super(viewPortHandler, xAxis, trans);
    }

    @Override
    protected void drawLabel(Canvas c, String formattedLabel, float x, float y, MPPointF anchor, float angleDegrees) {
//        super.drawLabel(c, formattedLabel, x, y, anchor, angleDegrees);
        //⬆這行要記得刪掉
        String[] lines = formattedLabel.split("\n");
        for (int i = 0; i < lines.length ; i++) {
            float vOffset = i* mAxisLabelPaint.getTextSize();
            Utils.drawXAxisValue(c, lines[i], x, y + vOffset, mAxisLabelPaint, anchor, angleDegrees);
        }

    }
}
這邊可能有一點難理解~我一行一行解釋
首先這裡
String[] lines = formattedLabel.split("\n");
這裏就是一個字串分割,首先先找出字串中的換行符號
再來關鍵是這行
float vOffset = i* mAxisLabelPaint.getTextSize();
這裏是偵測文字高度用的,利用迴圈數*文字高度,就能計算出文字位置
最後再將文字"畫"進去,就完成囉(・ω・)b
Utils.drawXAxisValue(c, lines[i], x, y + vOffset, mAxisLabelPaint, anchor, angleDegrees);
4. 修改MainActivity.java
最後是修改原先的MainActivity.java
直接給你程式,我標示修改的位置
public class MainActivity extends AppCompatActivity {
    public static final String TAG = MainActivity.class.getSimpleName()+"My";
    LineChart chart;
    ArrayList<String> customxLable = new ArrayList<>();

    @Override
    protected void onCreate(Bundle savedInstanceState) {
        super.onCreate(savedInstanceState);
        setContentView(R.layout.activity_main);
        chart = (LineChart)findViewById(R.id.linechart);
        setChart();
        Button btReset = findViewById(R.id.button_reSet);
        btReset.setOnClickListener((v)->{
            chart.clear();
            setChart();
        });

    }

    private void setChart() {

        ArrayList<HashMap<String,String>> mData = makeFakeData();
        for (int i=0;i<mData.size();i++){//自定義X軸標籤(一般為時間)
            customxLable.add("資料\n第"+(i+1)+"筆");
        }

        /**設定圖表框架↓*/
        YAxis leftAxis = chart.getAxisLeft();//設置Y軸(左)
        YAxis rightAxis = chart.getAxisRight();//設置Y軸(右)
        rightAxis.setEnabled(false);//讓右邊Y消失
        XAxis xAxis = chart.getXAxis();//設定X軸
        xAxis.setPosition(XAxis.XAxisPosition.BOTTOM);//將x軸表示字移到底下
        xAxis.setLabelCount(3,false);//設定X軸上要有幾個標籤
        chart.getDescription().setEnabled(false);//讓右下角文字消失
//        xAxis.setEnabled(false);//去掉X軸數值
        xAxis.setDrawGridLines(false);//將X軸格子消失掉
        xAxis.setValueFormatter(new MyValueFormatter());//設置X軸

        /**此處第二版新增*/
        MyMarkerView mv = new MyMarkerView(this, R.layout.custom_marker_view,customxLable,chart);//設置點擊標籤
        chart.setMarker(mv);//設置點擊標籤
        chart.setExtraBottomOffset(20f);//圖表上移20點,避免擋住X軸文字

        /**此處第二版新增*/
        //設置X軸標籤換行
        chart.setXAxisRenderer(new CustomXLabel(chart.getViewPortHandler(),chart.getXAxis()
                ,chart.getTransformer(YAxis.AxisDependency.LEFT)));
        /**設定圖表框架↑*/

        /**載入資料↓*/

        ArrayList<Entry> yValues1 = new ArrayList<>();
        ArrayList<Entry> yValues2 = new ArrayList<>();

        for (int i=0;i<mData.size();i++){
            float getFirst = Float.parseFloat(mData.get(i).get("FirstData"));
            float getSecond = Float.parseFloat(mData.get(i).get("SecondData"));
            yValues1.add(new Entry(i,getFirst));
            yValues2.add(new Entry(i,getSecond));

        }
        LineDataSet set1 = new LineDataSet(yValues1, "溫度");
        LineDataSet set2 = new LineDataSet(yValues2, "濕度");
        setChartImage(set1,1);//設置圖表線1
        setChartImage(set2,2);//設置圖表線2

        chart.animateX(2000);

        ArrayList<ILineDataSet> dataSets = new ArrayList<>();
        leftAxis.setAxisMaximum(100f);//設置上限
        leftAxis.setAxisMinimum(0f);//設置下限
        //其實上下限可以不用刻意設置,圖表會自動依數值調整到最適合的範圍
        dataSets.add(set1);
        dataSets.add(set2);
        LineData lineData = new LineData(dataSets);
        chart.setData(lineData);
        /**載入資料↑*/
     }
    ...(略)
}
粉底白字的是跟MarkerView相關的內容
而綠底白字則是與X軸相關的修改內容歐~
這週是母親節,我弟北漂好段時間了,難得從台北回來~
這篇文章..真的是好不容易生出來的的XD
畢竟為了慶祝母親節,又是吃大餐又是出去玩,好忙啊~(棒讀)
然後肥了1kg..難得減肥有成啊!!!!QQ
上週更是完全寫不出文章,我上週去打了AZ疫苗,然後整整攤睡了一天XD
不過其實我體質可能還不錯,我倒是除了一般常見的疫苗症狀之外,其他也都沒有
現在打完一瞄過一個禮拜,我已經完全沒事了!!
所以各位啊~不要聽信媒體危言聳聽,因為製造混亂就是他們的工作(笑)
那~這篇文章到這,如果本文對你有幫助~



 留言列表
留言列表
